Profiling Rust verification
 Automatic formal verification is usually pushing up against what Leino calls “the
decidability ceiling”: pushing the tools beyond what
they can be guaranteed to solve in some reasonable time, taking the risk that
the tools will blow up, but often getting away with it.
But what can we do when the toast lands butter-side-down?
This is a summary of a quick investigation to find out if
anybody had any answers. Tl;dr: they do.
Automatic formal verification is usually pushing up against what Leino calls “the
decidability ceiling”: pushing the tools beyond what
they can be guaranteed to solve in some reasonable time, taking the risk that
the tools will blow up, but often getting away with it.
But what can we do when the toast lands butter-side-down?
This is a summary of a quick investigation to find out if
anybody had any answers. Tl;dr: they do.
I found four relevant sources of information:
- Bornholt and Torlak, “Finding code that explodes under symbolic evaluation”, OOPSLA 2018
- Cadar and Kapus, “Measuring the coverage achieved by symbolic execution”, Blog 2020
- Galea et al., “Evaluating manual intervention to address the challenges of bug finding with KLEE”, arXiv 2018
- KLEE website, “Tutorial on How to Use KLEE to Test GNU Coreutils (sections 6 and 7)”, 2018?
(Huge thanks to Sean Heelan for his really useful response to my Twitter request for suggestions – resulting in the last two sources and which form the basis of most of the rest of this post.)
These are great resources and, if you want to learn more about this topic, I strongly recommend them. They have one minor problem though, none of them are about verifying Rust code which this website is all about. To make things more Rusty, I decided to try to apply the KLEE profiling ideas to some code I had recently tried to verify and that was scaling horribly. The code called the Rust regex crate and, like a lot of string-processing code, it was behaving so badly that I could only work with trivial length strings and carefully constrained regex queries.
I created a trivial benchmark test harness that matches a sequence of digits and asserts that converting those digits to an integer is less than some limit. This version should fail because one possible result is 11: I also tested with a non-failing variant that asserts “i <= 11”.
#[test]
fn regex_should_fail() {
    // generate a symbolic string of length 2
    let a = verifier::verifier_nondet_ascii_string(2);

    // assume the string consists of 0's and 1's
    verifier::assume(Regex::new(r"[0-1]{2}").unwrap().is_match(&a));

    // convert to int
    let i: u32 = a.parse().unwrap();

    // check the maximum value
    verifier::assert!(i < 11);
}
I expected that this would perform badly and I was not disappointed. Running our cargo verify tool to compile the code for verification and then use KLEE to verify it spent distressingly long in the verifier for such a short string.1
$ cargo verify --test=regex_should_fail -v
Using Klee as backend
Checking regex
  Building regex for verification
  Patching LLVM file for initializers and feature tests
  Checking regex_should_fail
Running 1 test(s)
test regex_should_fail ... ASSERT_FAILED
test result: ASSERT_FAILED. 0 passed; 1 failed
Build 47.085s
Verify 37.907s
Total 84.992s
VERIFICATION_RESULT: ASSERT_FAILED
The problem was probably in the Regex library, the question was whether I could pin down which lines of code were responsible?
The KLEE tutorial explains that KLEE generates a profile of the verification process that gives you various metrics about every line of code in your program (including any libraries that you linked against). And both Galea et al. and Bornholt and Torlak highlight the performance impact of path splitting on the cost of symbolic execution. So what I needed to do was run the kcachegrind tool on the profile file generated by KLEE.
Before I could do that though, there was one small problem to take care
of. Looking inside the profile file, I could see that it was referring
to functions by their “mangled” names like
_ZN5regex17regex_should_fail17h11a2866ac324f18dE
intead of human-readable names like
regex::regex_should_fail.
To fix this, I wrote a small demangling tool that could demangle the
profile file.
With this in place, I could demangle the profile and view it like this
$ rust2calltree kleeout/regex_should_fail/run.istats -o callgrind.out
$ kcachegrind
This produced a window that looked like this (I have selected the “forks” metric and clicked on the most expensive function that is not my test harness.)
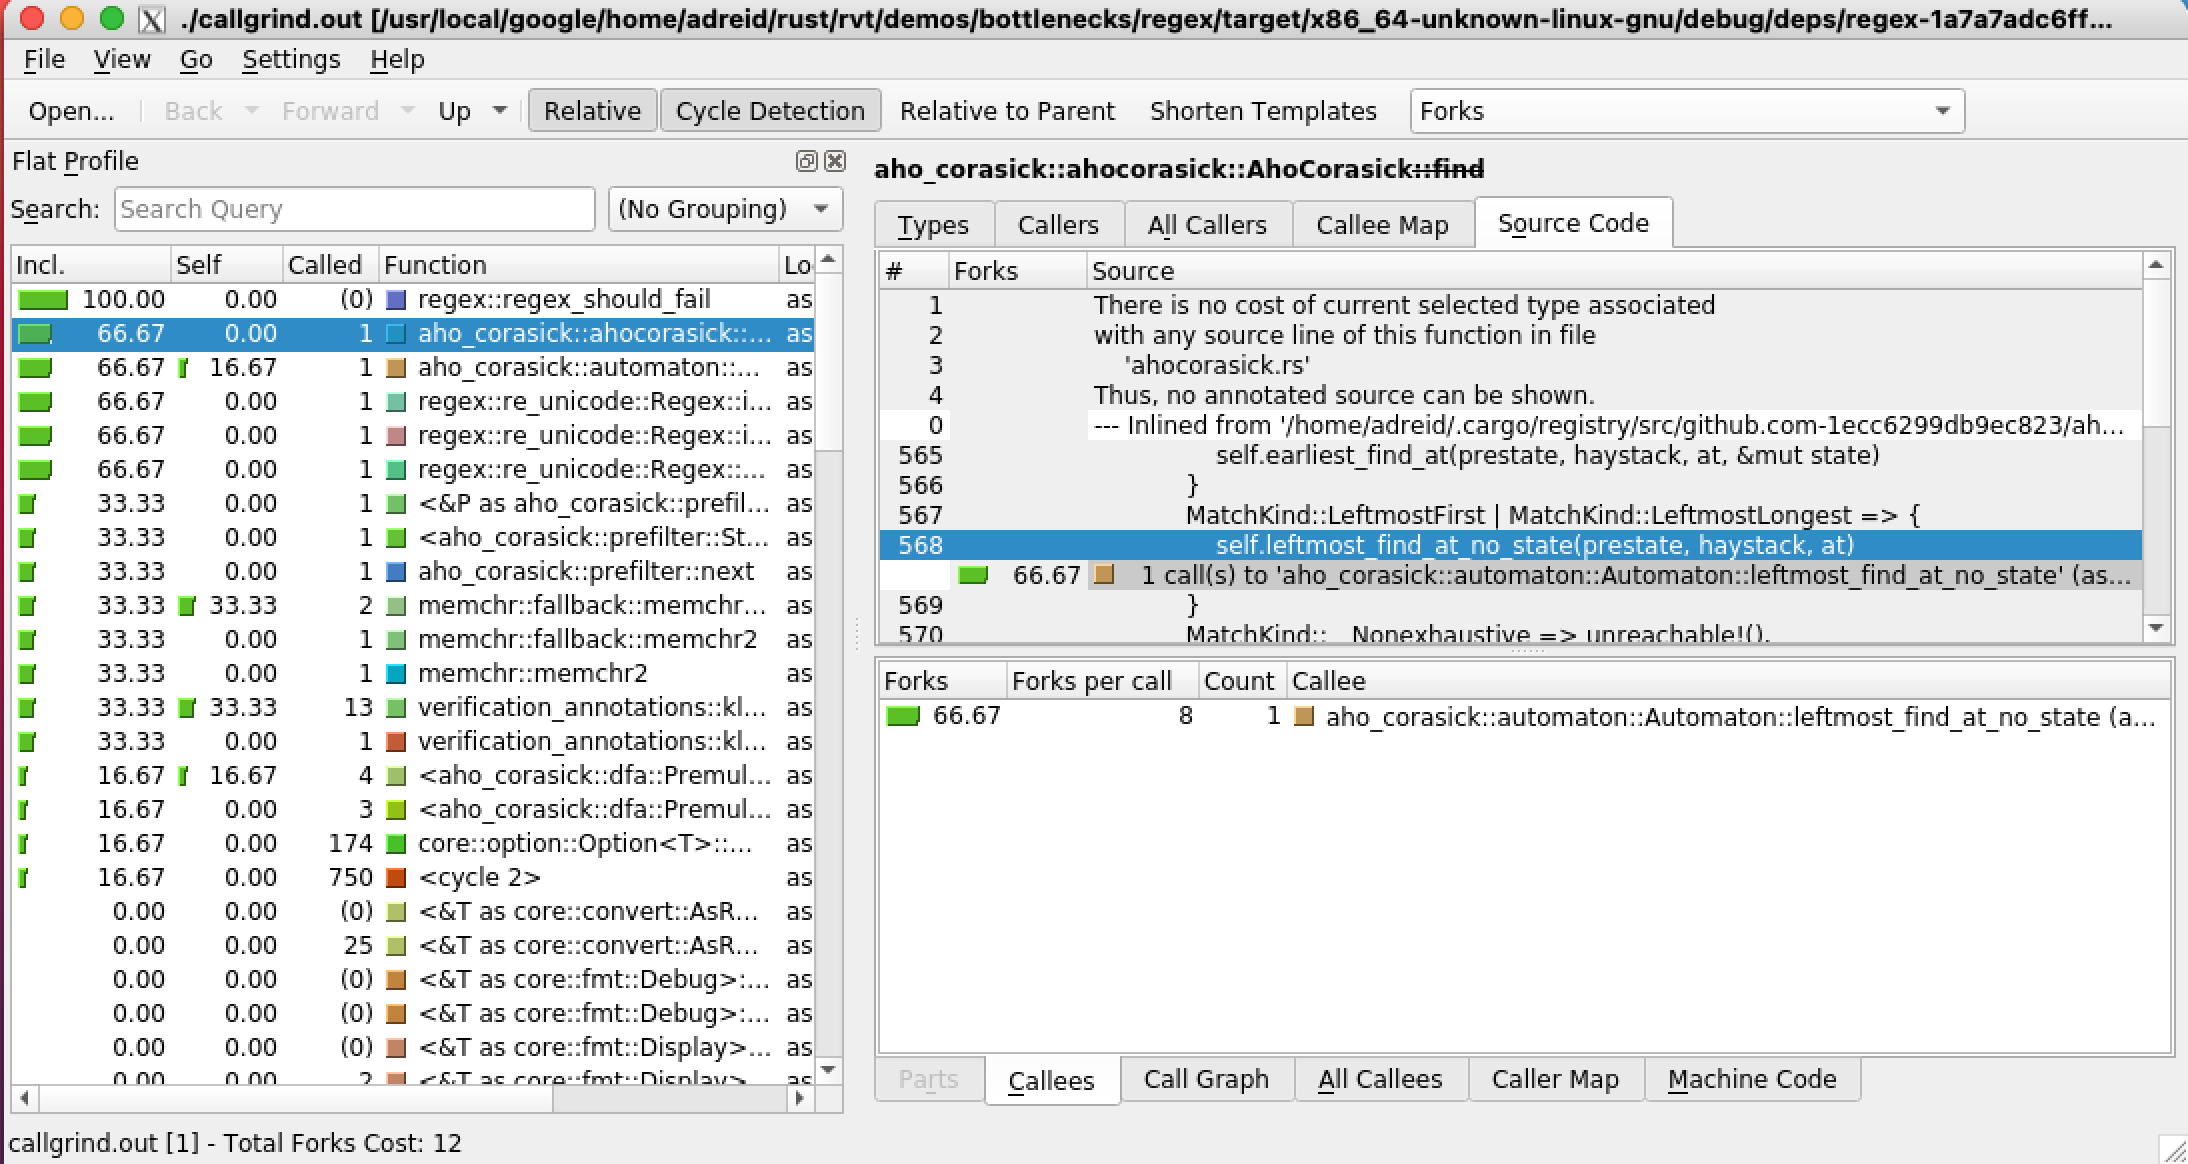
This profile shows that the function that is most responsible for
the path explosion in my benchmark is the function
aho_corasick::ahocorasick::AhoCorasick::find.
This was a surprise to me – I was expecting that it would be complaining about part of the regex crate that my benchmark was calling. I did a little digging and I quickly found out that the aho-corasick crate was a fast string matching library used by the regex crate for simple parts of regexps. Since my regexp was quite simple, it seemed reasonable that this crate would be doing most of the work and therefore would be potentially part of the problem. (I didn’t confirm that this really was the problem. To do that, I would probably have to modify the Aho-Corasick crate to fix the problem – which I have not tried doing, yet.)
Summary
Verification tools are very likely to hit performance bottlenecks because they are designed to push against the decidability ceiling.
There has not been a lot of work on profiling to help you identify what part of your code is responsible for any performance problems you hit when trying to verify your code but the papers/tutorials that I found were very useful and are worth reading.
With the aid of a little script, I was able to use the instructions in the KLEE tutorial to profile a small benchmark and it produced results that seemed entirely plausible and that highlighted some code that I would probably not have looked at first.
The task of confirming that the code identified by profiling can be “fixed” is something that I leave for future work.
-
You will notice that compilation time is even worse than verification time. Part of this is due to the time fetching and compiling the regex library and part of it this is due to our tool not making good use of cargo’s incremental compilation. We plan to fix this – but it is not our priority at the moment. ⤾